My Uncle Bob is an intelligent self made octogenarian. After owning a successful business, he retired early and has lived a life of travel and adventure for almost 30 years. Despite working with automation for most of his life, he does not trust anything in the way of new technology and approaches everything new, with tough questions.
When he asked me to scan his home for heating losses I knew right away that I might have to do more than to show him. I was rather reluctant to do this scan as I really did not have much of an idea how I could help him understand. After all, as a thermal imager, all I could do is show him pretty pictures. Undaunted, I spent many hours at his home making lots of pretty pictures. He had many more problems than the pretty pictures of his home that I present here but these thermographs show the worst of his problems.

Exterior basement wall which is not insulated on the interior side.
Poor older double sliding windows that are not gas filled and insulating.

Poorly insulated front door entry.

This is the intake and return on the ground source heat pump. The temperature of the intake line is below freezing (it was a cold winter). The efficiency of the heat pump is very poor due to the cold intake temperature which should have been closer to 10 degrees C. which was guaranteed by the installer. The heat pump uses glycol in the lines which prevents freezing.
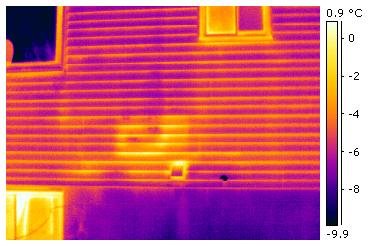
This home measures well over 3000 square feet and has an indoor pool in the basement which was powering the heat losses in the exterior wall in the first thermograph shown above.
When I take my thermal images, I try to present them so that the eye of the customer is drawn to the items which I want him or her to see. I use Ironbow as the palate because I think it best shows the fault. I spent a day or two compiling all the data and measuring temperatures and presented my Uncle Bob with the report. I could tell right away that my Uncle Bob was unimpressed. No matter how well we do our reports there are just too many cynics in the world. I went home and awaited the inevitable questions. Only one was asked and it was asked sooner than expected.
When I got home there was a message on the answering machine! One question was asked, "How much is this costing me?".
I was a little stumped. Because I was still thinking in terms of temperature, I really did not know how I could help with this. However it did start me thinking on different terms. Instead of temperatures I began to think more of radiation. Our thermal cameras really never see temperature in an object. We can calculate an approximate contact temperature of an object by setting the expected emissivity of our objects, in our cameras. Or we can set the emissivity of the camera to unity (1) and see the 'RADIATING TEMPERATURE' which is the temperature that the object emits to the surrounding environment.
Although our cameras measure temperatures, they actually see and record Infrared Radiation. This is the data that gives us the pretty pictures. Anything in a thermograph that looks warm is Radiating at its surrounding environment and if we capture the temperature of the surrounding environment we can calculate the power transfer from warm to cold. If the heat losses are in stasis the heat losses will be continuous and this means continuous power losses. Depending on changing Radiating temperatures in the surrounding environment, the amount of the power losses will rise or fall.
After several weeks of playing, and with some help from the experts at FLIR Canada, I was able to build templates which can be used to calculate Radiating Heat Losses. The templates are used with the Reporter software that comes with the camera. They enable the quick calculation of Radiating losses of a radiating (or absorbing) object to its surrounding environment. This is the tool I needed to impress my Uncle Bob. The first report generated by this template is shown below.
Exterior Wall Calculated Radiated Heat Loss
This is an estimate of heat loss from infrared radiation on an exterior wall. This calculation will be affected by the size of the warm area and the absorbtion temperature of the cold spot which captures the radiating temperature of the surrounding environment. Convective cooling (wind) on the surface being measured, changing temperatures from day to day and other factors will affect the calculation. This is a snapshot of losses but the actual losses could be SUBSTANTIALLY higher.

Object Parameter Value
Emissivity 1.0
Label Value
Cold Spot -18.1 C.
Warm Area -11.0 C.
Fo1 27.8 Watts per square meter
The entire wall, including areas covered by brush and partially hidden, measures 21 square meters. Therefore the total heat lost by this wall is approximately 600 watts per hour at the time the thermograph was taken. These losses will change as the surrounding environment absorbtion temperatures change and will be much greater when the absorbtion temperatures are colder.
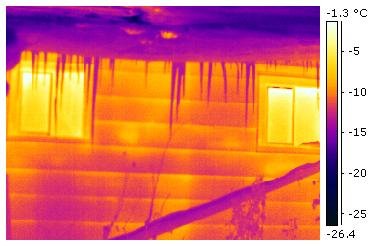
Using another developed to measure interior cold spots, I could calculate the power lost by his front door because of poor door insulation.
Interior Wall Calculated Radiating Heat Loss
This is an estimate of heat loss from infrared radiation on an interior wall. This calculation will be affected by the size of the cold area and the radiating temperature of the interior environment which is captured by the warm spot. Convective cooling (wind) on the surface being measured, changing radiating temperatures from day to day and other factors will change the calculation. This is a snapshot of the losses but actual losses could be SUBSTANTIALLY higher.

Object Parameter Value
Emissivity 1.0
Label Value
Warm Spot 19.8 C.
Cold Area Average 15.2 C.
Fo! 26.1 watts per square meter
The size of the cold area on this door is about 2 square meters so the door is losing about 50 watts per hour of power at the time the snapshot temperature was taken.
Sad to say that my Uncle Bob was still unimpressed. His home is still the same today but at least I was able to give him something for numbers. Since all of the walls in his pool area in the basement were uninsulated, after using the templates to calculate the total losses in the basement, the actual losses were close to 3500 watts per hour just in the pool room area. With that number in mind, he decided to make some improvements.
The next entry will look at even more uses of the templates and will give us more numbers to ruminate.